Show the code
import openpyxl
import numpy as np
import pandas as pd
from scipy.stats import norm
from IPython.display import Markdown
from tabulate import tabulate
import seaborn as sns
import matplotlib.pyplot as pltNormality and heterogeneity of grades scale
A common step before building a model is to determine the optimal number of observations required. In credit scoring, it’s not only essential to know the total number of observations, but also the optimal number of defaults needed to develop a meaningful and reliable model.
In the case of a low-default portfolio (LDP), defaults are rare, making it difficult to assess whether constructing a model is even possible. Rather than building a model blindly and relying on luck for acceptable performance, it is crucial to first determine the minimum number of defaults required to justify model development.
This determination must satisfy both statistical and regulatory constraints. From a statistical perspective, the sample must be representative, with a distribution that reflects the underlying population. On the regulatory side, authorities typically require that a rating model include at least seven distinct grades (e.g., AAA, AA, A, BBB, BB, B, C).
Failing to meet these conditions can lead to regulatory sanctions, delays due to corrective actions, and financial costs for the institution.
This brings us to the question, What is the optimal number of defaults required to build a seven-grade rating model for a low-default portfolio that satisfies both statistical rigor and regulatory expectations, while ensuring heterogeneity between rating grades?
It is important to define the perimeter over which data will be collected. This is done by considering several criteria. If we consider a portfolio made up of large corporations, we can define the perimeter based on company size—for example, a turnover above a certain threshold (100 million euros), the region (Europe, North America, etc.), or the sector (agriculture, industry, services, etc.).
What characterizes large companies is that they rarely default—that is, they generally meet their financial obligations to creditors. As a result, if we assign them ratings on a seven-grade scale (AAA, AA, A, BBB, BB, B, C), very few companies would receive a C rating. Most companies would fall within the intermediate grades (A, BBB, BB), and only a few would receive the highest rating (AAA). Therefore, the distribution of ratings tends to resemble a normal distribution.
Going forward, we will assume that our portfolio consists of large corporations and that the rating scale follows a normal distribution.
If you’re interested in reproducing this work, you can use a portfolio of your choice and define your own distribution of ratings across the grades.
To effectively assess the credit risk of counterparties, it’s important that the rating scale is both homogeneous within each category and heterogeneous across categories. In other words, observations within the same rating grade should share similar characteristics — meaning they represent the same level of risk — while observations in different rating grades should reflect distinct risk profiles.
We won’t address within-grade homogeneity in this post.
To ensure heterogeneity across rating categories, we’ll use the binomial test to compare the proportions of observations assigned to each grade. The difference in proportions will be evaluated under the assumption that it follows a normal distribution with a mean of zero — which serves as the null hypothesis.
By dividing the difference by its standard deviation, we obtain a standardized value that follows the standard normal distribution. \[ Z = \frac{p_1 - p_2}{\sqrt{\frac{p_1(1-p_1)}{n_1} + \frac{p_2(1-p_2)}{n_2}}}. \] Where \(p_1\) and \(p_2\) are the proportions of observations in the two rating categories being compared, and \(n_1\) and \(n_2\) are the number of observations in each category.
This section outlines the procedure used to determine the optimal number of defaults when constructing a default model with seven rating grades.
First, we need to determine how many observations fall into each rating grade. Given a total number of observations \(N\) and assuming a seven-grade scale (AAAA, AA, A, BBB, BB, B, C), we compute the number of observations per grade using the normal distribution. That means calculating the probability associated with each grade and multiplying it by \(N\).
There are many ways to assign probabilities across grades, but we choose this method because it is deterministic and replicable. Other approaches, including random sampling techniques, could be used as well. In our case, the number of observations for each grade is generated based on the following methodology:
Computing the probability density function (PDF) of the normal distribution for each grade.
\[ P(\text{AAAA}) = \frac{F(\text{AAAA} + \epsilon)}{2\epsilon}, \]
where \(F\) is the cumulative distribution function (CDF) of the normal distribution and \(\epsilon \to 0\). We assume \(F(\text{AAAA} - \epsilon) = 0\).
\[ P(\text{Grade}) = \frac{F(\text{Grade} + \epsilon) - F(\text{Grade} - \epsilon)}{2\epsilon}, \]
\[ P(\text{C}) = \frac{1 - F(\text{C} - \epsilon)}{2\epsilon}. \]
The number of observations in each grade is then computed as:
\[ N_{\text{grade}} = N \cdot P(\text{grade}). \]
Next, we determine the number of defaults for each grade while ensuring heterogeneity between them. In the context of low-default portfolios (LDP), the highest rating (AAAA) is expected to have very few defaults. So, we begin by fixing the number of defaults for grade AAAA at 1.
To compute the number of defaults for grade \(i+1\) based on grade \(i\), we follow this approach:
The two grades must be heterogeneous, meaning the null hypothesis of the binomial test (that the default rates are equal) must be rejected at a significance level \(\alpha\). This leads to the following statistical condition:
\[ P(Z = \frac{|p_i - p_{i+1}|}{\sqrt{\frac{p_i(1 - p_i)}{N_i} + \frac{p_{i+1}(1 - p_{i+1})}{N_{i+1}}}} \geq Z_\alpha) = \alpha, \]
where \(p_i\) and \(p_{i+1}\) are the default rates for grades \(i\) and \(i+1\), and \(N_i\), \(N_{i+1}\) are the respective numbers of observations. \(Z_\alpha = \Phi^{-1}(1 - \alpha/2)\), where \(\Phi^{-1}\) is the inverse of the cumulative distribution function of the standard normal distribution.
is the critical value of the standard normal distribution for the chosen confidence level.
We can rewrite this condition using the pooled default rate:
\[ p = \frac{N_i p_i + N_{i+1} p_{i+1}}{N_i + N_{i+1}}. \]
Then the \(Z\)-statistic becomes:
\[ P(Z = \frac{|p_i - p_{i+1}|}{\sqrt{p(1 - p)\left(\frac{1}{N_i} + \frac{1}{N_{i+1}}\right)}} \geq Z_\alpha ) = \alpha, \]
Now, let \(e = p_{i+1} - p_i\). Then:
\[ p_{i+1} = p_i + e. \]
Once \(p_{i+1}\) is known, the number of defaults for grade \(i+1\) is:
\[ n_{i+1} = p_{i+1} \cdot N_{i+1}. \]
To find the value of the optimal \(e\) that satisfies the heterogeneity condition, we solve the equation:
\[ Z = \frac{e}{\sqrt{p(1 - p)\left(\frac{1}{N_i} + \frac{1}{N_{i+1}}\right)}} = Z_\alpha, \]
This leads to a second-degree equation of the form:
\[ ae^2 + be + c = 0. \]
with coefficients:
\[ a = -\left[\left(\frac{N_{i+1}}{N_i + N_{i+1}}\right)^2 + \frac{1}{Z_\alpha^2\left(\frac{1}{N_i} + \frac{1}{N_{i+1}}\right)}\right], \]
\[ b = (1 - 2p_i)\left(\frac{N_{i+1}}{N_i + N_{i+1}}\right), \]
\[ c = p_i(1 - p_i), \]
Since \(a < 0\) and \(c > 0\), the quadratic equation has two real roots — one negative and one positive. We select the positive solution:
\[ e = \frac{-b - \sqrt{b^2 - 4ac}}{2a}. \]
import openpyxl
import numpy as np
import pandas as pd
from scipy.stats import norm
from IPython.display import Markdown
from tabulate import tabulate
import seaborn as sns
import matplotlib.pyplot as pltTo implement the method, we use Python. The number of defaults for the highest grade (AAAA) is fixed at 1. A simulation is then conducted by varying the total number of observations from 1,000 to 10,000 in steps of 1,000. The optimal number of defaults is defined as the average number of defaults across all simulations.
The code below simulates how observations are distributed across rating grades based on the normal distribution. We assume a mean of 4 (corresponding to grade BBB) and a standard deviation of 1. The number of observations in each grade is determined by multiplying the total number of observations by the probability density function (PDF) of the normal distribution centered at each grade (see Figure 1).
def generate_obs_pdf(N, mu, sigma,espilon=0.5):
    grades = ['AAAA', 'AA', 'A', 'BBB', 'BB', 'B', 'C']
    grades_positions = np.arange(1,len(grades)+1)
    prob = np.zeros(len(grades))
    prob[0] = norm.cdf(grades_positions[0] + espilon, mu, sigma)
    prob[6] = 1 - norm.cdf(grades_positions[6] - espilon, mu, sigma)
    for i in range(1, len(grades)-1):
        prob[i] = norm.cdf(grades_positions[i] + espilon, mu, sigma) - norm.cdf(grades_positions[i] - espilon, mu, sigma)

    obs_count = (prob * N).round().astype(int)
    count_int = np.floor(obs_count).astype(int)
    remainder = N - count_int.sum()
    fractional_part = obs_count - count_int
    sorted_indices = np.argsort(-fractional_part)
    for i in range(remainder):
        count_int[sorted_indices[i]] += 1

    obs_count = pd.Series(obs_count, index=grades)
    return obs_count
# Define the parameters
N = 5001
mu = 4
sigma = 1
# Generate the number of observations per grade
obs_count = generate_obs_pdf(N, mu, sigma)


# Plot the results and add the number of observations in each grade
plt.figure(figsize=(8, 5))
sns.barplot(x=obs_count.index, y=obs_count.values)
plt.title(f'Number of Observations per Grade (N={N}, mu={mu}, sigma={sigma})')
for i, v in enumerate(obs_count.values):
    plt.text(i, v + 0.5, str(v), ha='center', va='bottom')
plt.xlabel('Grade')
plt.ylabel('Number of Observations')
plt.xticks(rotation=45)
plt.show()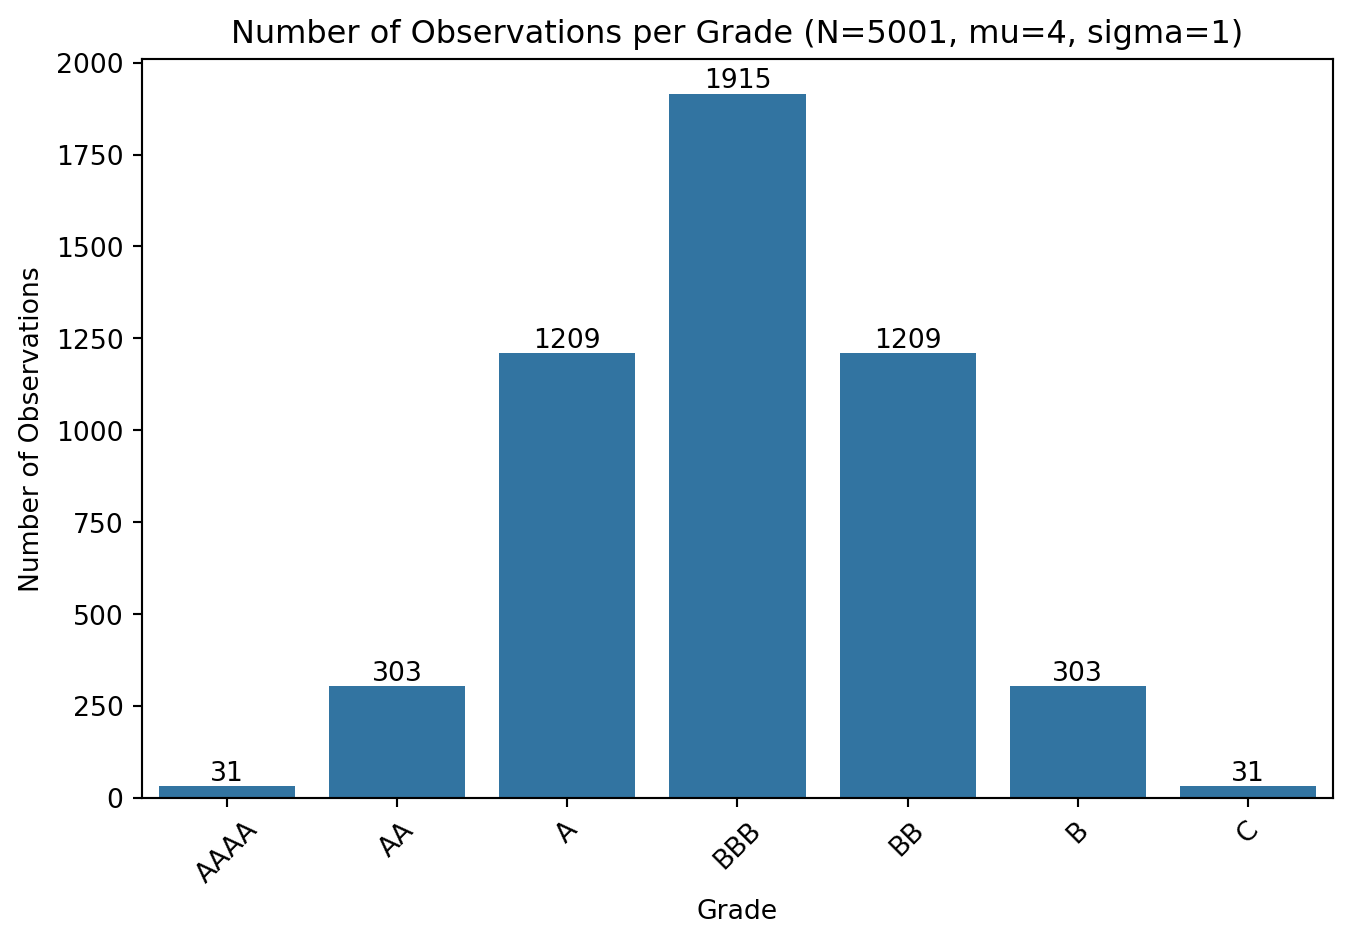
The following code estimates the number of defaults for each grade, given the total number of observations, while ensuring heterogeneity between consecutive grades. This is done using the binomial test at a significance level \(\alpha = 0.05\) (see Table 1).
def generate_defaut_per_grade(N, mu, sigma, alpha):
    df_obs = generate_obs_pdf(N, mu, sigma)
    grades = df_obs.index
    n = df_obs.values

    # Initialisation des vecteurs
    z_alpha = norm.ppf(alpha/2)
    k = len(n)
    d_rate = np.zeros(k)
    ecart = np.zeros(k)
    p_moy = np.zeros(k)
    stats = np.zeros(k)
    p_vals = np.zeros(k)
    n_def = np.zeros(k, dtype=int)

    # Conditions initiales
    n_def[0] = 1
    d_rate[0] = 1 / n[0]

    for i in range(1, k):
        n1, n2 = n[i-1], n[i]
        prev_rate = d_rate[i-1]
        frac = n2 / (n1 + n2)

        # Coefficients quadratiques
        a = - (frac**2 + 1 / (z_alpha**2 * (1/n1 + 1/n2)))
        b = (1 - 2 * prev_rate) * frac
        c = prev_rate * (1 - prev_rate)
        delta = b**2 - 4*a*c

        if delta < 0:
            raise ValueError(f"No real solution at i={i} (delta < 0)")

        ecart[i] = (-b - np.sqrt(delta)) / (2 * a)
        d_rate[i] = prev_rate + ecart[i]
        n_def[i] = int(round(d_rate[i] * n[i]))
        p_moy[i] = prev_rate + ecart[i] * frac

        var = p_moy[i] * (1 - p_moy[i]) * (1/n1 + 1/n2)
        stats[i] = ecart[i] / np.sqrt(var)
        p_vals[i] = 2 * (1 - norm.cdf(abs(stats[i])))

    return pd.DataFrame({
        'Grade': grades,
        'nb obs': n,
        '#defaut': n_def,
        'pct defaut': d_rate,
        'écart pct defaut': ecart,
        'proba moyenne': p_moy,
        'statistic': stats,
        'p-value': p_vals
    })

# Exemple d'appel
N = 5001
mu = 4
sigma = 1
alpha = 0.05
df_defaut = generate_defaut_per_grade(N, mu, sigma, alpha)
# Display the results
print(tabulate(df_defaut, headers='keys', tablefmt='psql', showindex=False))
df_defaut.to_excel('df_defaut.xlsx', index=False)+---------+----------+-----------+--------------+--------------------+-----------------+-------------+-----------+
| Grade | nb obs | #defaut | pct defaut | écart pct defaut | proba moyenne | statistic | p-value |
|---------+----------+-----------+--------------+--------------------+-----------------+-------------+-----------|
| AAAA | 31 | 1 | 0.0322581 | 0 | 0 | 0 | 0 |
| AA | 303 | 50 | 0.165283 | 0.133025 | 0.152936 | 1.95996 | 0.05 |
| A | 1209 | 261 | 0.216208 | 0.0509256 | 0.206003 | 1.95996 | 0.05 |
| BBB | 1915 | 472 | 0.246731 | 0.0305224 | 0.234918 | 1.95996 | 0.05 |
| BB | 1209 | 336 | 0.278268 | 0.0315377 | 0.258936 | 1.95996 | 0.05 |
| B | 303 | 102 | 0.335389 | 0.0571204 | 0.289715 | 1.95996 | 0.05 |
| C | 31 | 16 | 0.511876 | 0.176487 | 0.351769 | 1.95996 | 0.05 |
+---------+----------+-----------+--------------+--------------------+-----------------+-------------+-----------+This final simulation estimates the optimal number of defaults by computing the average number of defaults over multiple runs. The number of observations varies from 5,000 to 1,000,000 in increments of 5,000(see Figure 2).
plt.figure(figsize=(8, 5))

N_values = np.arange(5000, 1000000, 5000)
optimal_defaults = [generate_defaut_per_grade(N, mu, sigma, alpha)['#defaut'].sum() for N in N_values]
mean_defaults = np.mean(optimal_defaults)
plt.plot(N_values, optimal_defaults, marker='o')
plt.axhline(mean_defaults, color='r', linestyle='--', label=f'Mean Defaults: {mean_defaults:.2f}')

########################################
# Ajout de texte pour afficher la valeur de la moyenne
##########################################
plt.text(N_values[-1], mean_defaults, f'Mean: {mean_defaults:.2f}', color='red', fontsize=10, ha='left', va='center')
plt.title('Optimal Number of Defaults vs. Number of Observations')
plt.xlabel('Number of Observations')
plt.ylabel('Optimal Number of Defaults')
plt.xticks(rotation=45)
plt.legend()
plt.grid(False)
plt.show()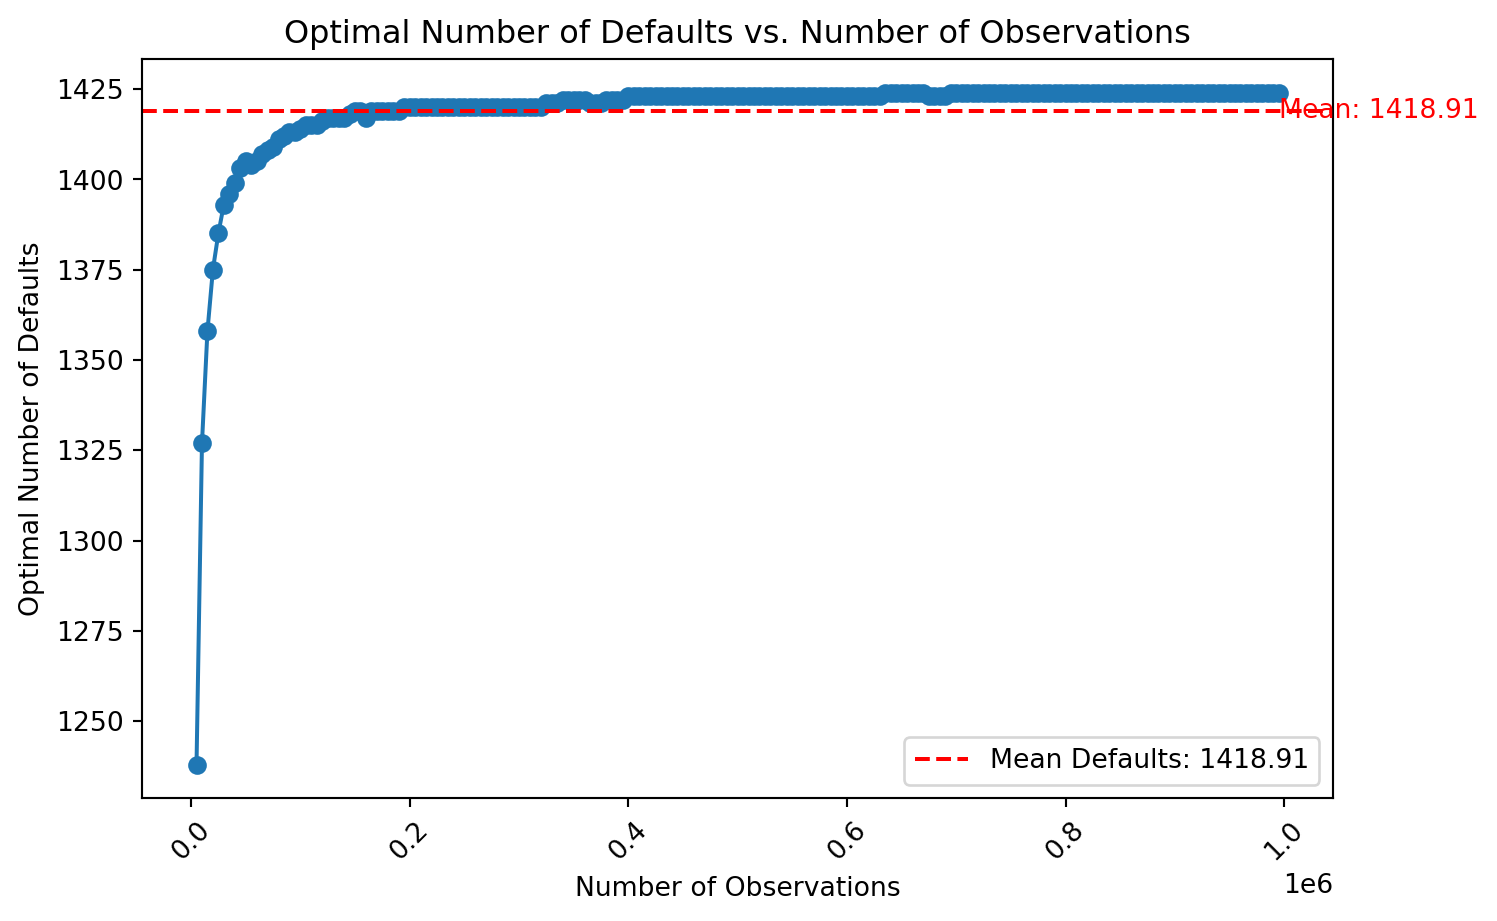
This study addressed a fundamental challenge in credit risk modeling: determining the optimal number of defaults required to develop a reliable and regulatory-compliant rating model, particularly for low-default portfolios (LDPs). Building such models without sufficient defaults not only compromises statistical robustness but also risks non-compliance with regulatory expectations, especially the requirement of a seven-grade rating scale. Through a structured and reproducible methodology based on the normal distribution of credit grades and binomial statistical tests, the research demonstrated how one can estimate the number of observations and defaults per grade necessary to ensure heterogeneity between rating categories. A key insight from the simulation was that, even with increasing total observations, the number of defaults required stabilizes - highlighting that data quantity alone does not compensate for data quality or risk signal strength. The implications of these findings are significant for risk managers and model validators. Institutions should not only focus on collecting more data but also ensure they meet a minimum threshold of defaults (estimated at 1,419) to build a statistically valid model. This threshold acts as a benchmark for initiating model development, validating its structure, and anticipating regulatory scrutiny. Nevertheless, the approach is not without limitations. The model assumes a normal distribution of credit grades and does not explore within-grade homogeneity or other sources of model uncertainty such as macroeconomic shocks, structural breaks, or portfolio shifts. Additionally, the focus on large corporate portfolios may limit generalizability to other segments like SMEs or retail. Future research could refine the simulation under alternative rating distributions.In conclusion, this research provides a quantitative foundation for institutions managing low-default portfolios to assess their readiness for model development. It encourages a shift from ad hoc modeling toward data-driven thresholds, reinforcing both statistical credibility and regulatory alignment in credit risk modeling.